
ux strategy / product design (ux/ui)
interaction design
The Youth Development Department (YDD) was established in the summer of 2022.
The department's mission is to help youth in LA successfully transition into adulthood while actively including experiences and perspectives of youth in citywide decision-making through the formation of the Olivia E. Mitchell Youth Council (OMYC).
The OMYC seats 30 empowered youth representing districts throughout the city. During their one-year term, members learn about the inner workings of local government and make policy and budget recommendations to LA's elected leaders to improve the well-being, safety and achievements of young Angelenos.
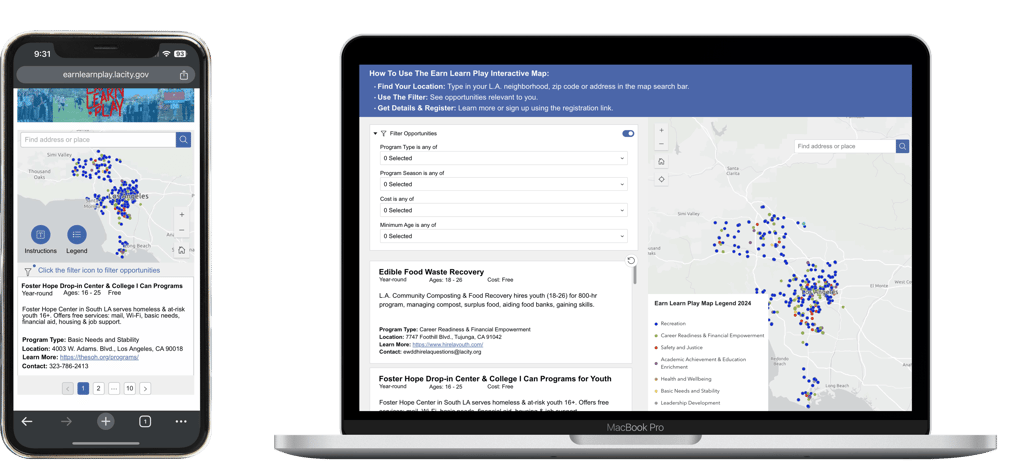
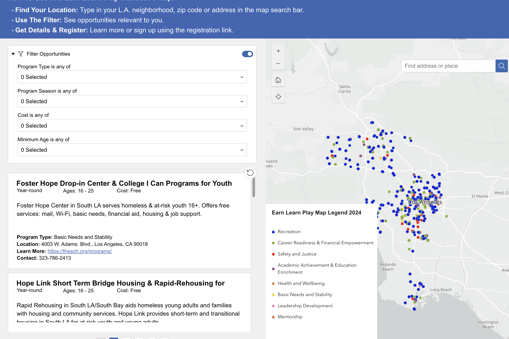
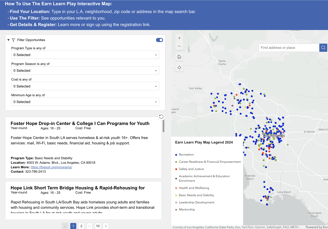
Earn Learn Play (ELP) is a citywide public initiative that helps youth and parents discover a variety of free programs and activities offered by the City of Los Angeles. By inputting a L.A. zip code, neighborhood name or direct address into the interactive map, users can discover employment opportunities and free academic & recreational enrichment programs near them.
OMYC members and YDD fellows directly guided the progression of the product by participating in surveys, listening sessions and sharing iterative feedback throughout the development process.


Project Background
"We want to make sure young folks in the city are safe, happy, and have what they need to succeed by creating programs and policies based on what works, and we want young people to be at the center of it all."
- YDD, City of Los Angeles
Problem
Research conducted by the city reported that 1.2 million youth under the age of 25 want to contribute to the city yet face immense challenges in accessing opportunities as they aim to pursue their goals.
Research cites the top 4 worries of youth are not having enough money, not doing well in school, mental wellness, and crime in their communities.
1,631 youth are experiencing homelessness
13,000 more are unemployed since the pandemic
14% of youth are disconnected from school & work
Recreation
Career Readiness & Financial Empowerment
Academic Achievement & Education Enrichment
Safety & Justice
Health & Wellbeing
Basic Needs & Stability
Leadership Development
Mentorship
“I think it is important for the new Mayor of Los Angeles to understand that this is a difficult time for many teens for numerous reasons. The effects of the pandemic, recent plummet in mental health, and increase in social media usage... have caused a lot of hardship for many teens and have left them feeling alone. The pandemic has caused many teens to feel isolated, unmotivated, unhappy, and has created a generation-wide sense of worry and stress.”
-18 year old female, CD
6,585 unique data entries were submitted.
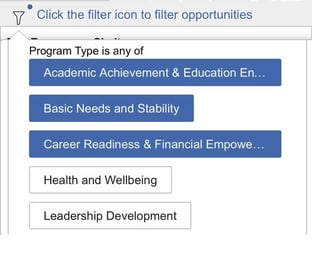
YDD established 8 opportunity categories in response to directly supporting the needs of Angelenos youth.
Then, YDD collaborated with 20 city departments and collected data on programs offered for youth.
Challenge
Redesign a mobile-first & responsive interactive map app within a Geographic Information System that is easy to use for LA youth (16-24), parents and local government.
Result
Engagement time increased by 6x.
12K+ visits to the map.
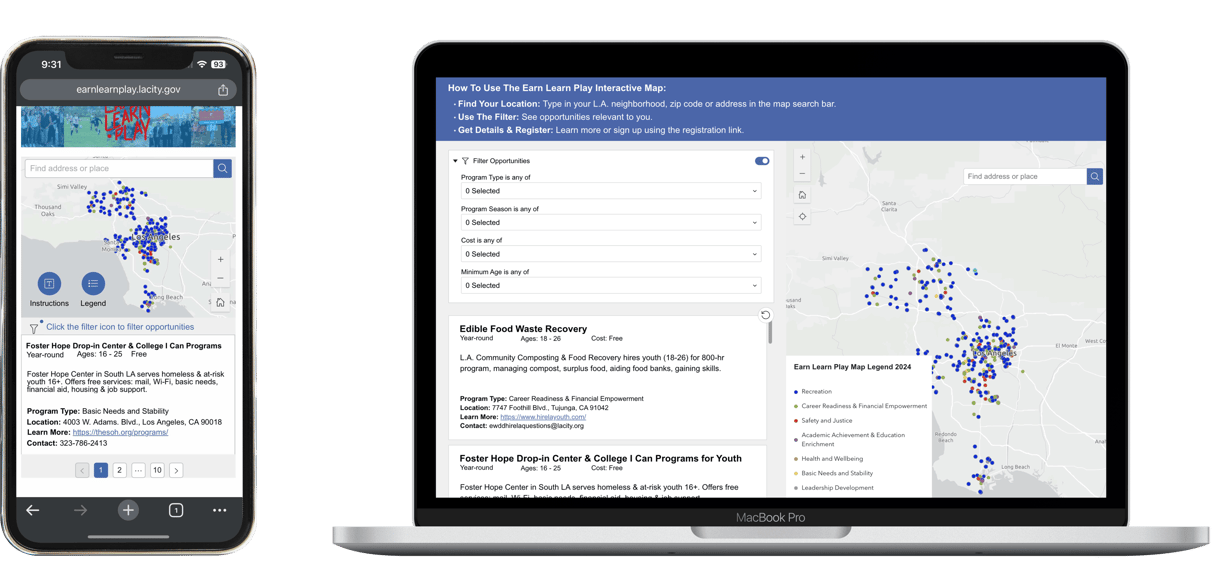
Users can enter a zip code, LA neighborhood name, or direct address into the map and view closest opportunities.
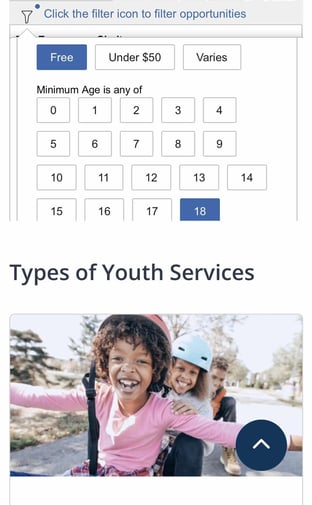
Users can filter opportunities based on opportunity category, season, age and cost.
"It's cool to see all the data that we were working with be visible on this map. I will definitely be using this as a resource during my youth intake and case management"
- City Pathways Fellow
Earn Learn Play Interactive Map Redesign 2024
User Discovery
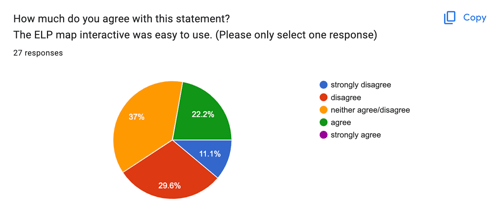
Insight #2: Focus on simplicity
40% disagree that current app was easy to use and 37% were neutral.
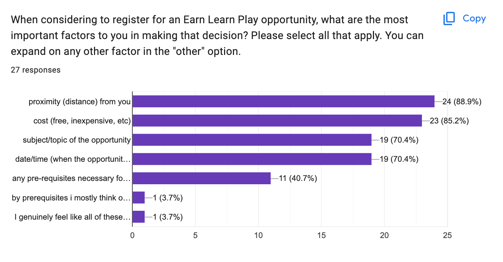
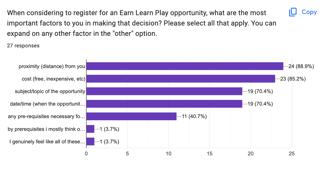
Insight #1: Distance to opportunity is priority
89% of survey respondents cared about proximity to the opportunity as youth voiced needing to use public transportation and don't own a car.
Through a pre-redesign SWOT analysis, survey, moderated focus group and user task analysis study, insights informed the most relevant functionalities for target audience and enhanced a deeper understanding designing for youth (16-24).
initial user requirements:
easy to use
search ability
increase interactivity
mobile-first design
'location-specific'
show commute route?
Next Step:
Research and determine platform tools and software widgets that meet user goals.
Feedback included having some way to search through the abundant data and having smoother map interactions, especially on mobile.

ELP 1.0 : "Near Me"
Technical issues arise...
In practice, analyzing 6,585 unique data within the widget was slowing down speed which resulted in not being shown information right away to the user.
The widget structure also required too many clicks from the user to see key information, especially on mobile devices. The information needed to be available quickly at a glance (browse-ability).
In discussions with the team, we also realized that even though distance was important, not all opportunities presented would be relevant to the user (age criteria/interest etc).
If 0 relevant opportunities appeared, users had to expand the radius themselves which prompted additional steps making the app less intuitive.
We also had to consider the ability for users to filter the opportunities easily.

Next Step:
Build out more robust features including a seamless filter capability and test.
Using the 'near me' software widget, we configured data to reveal opportunities within a 3 mile radius by default.
Once the programs were revealed, users can get a quick snippet of the opportunity by viewing the title, for example: "Civic Engagement Specialist Internship" or "Transition Age Youth Emergency Shelter".
In theory, this feature was a good solution to support the need to only view nearby opportunities while decreasing cognition overload with 6,585 unique programs available (includes age differentiation such as swim classes for different age groups).
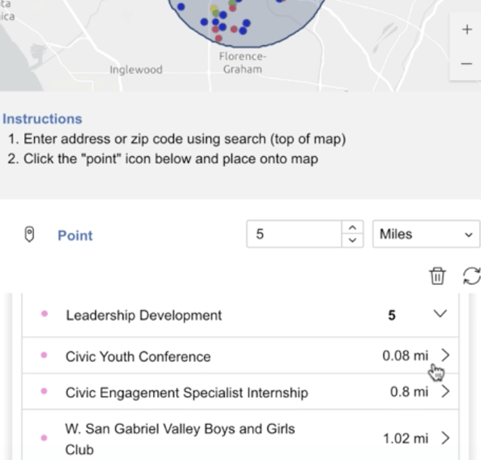

see total number of opportunities available within a specified mile radius from any location
ELP 2.0 : Data-rich but user-driven, building robust features
Enhanced discoverability of data results by cleaning and standardizing all data across the 20 departments
Reevaluated user flows by making mobile touchpoints as simple as possible and leveraged mobile dimensions as smart as possible.
Designed a search result card layout to display all crucial information in one glance to bypass too many clicks to get to content
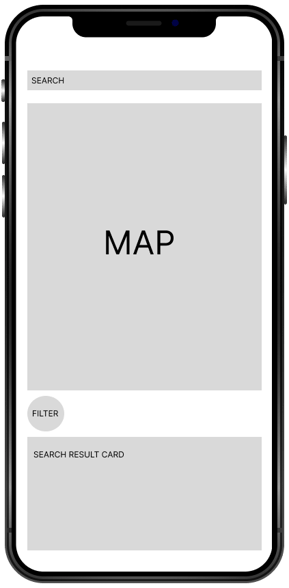
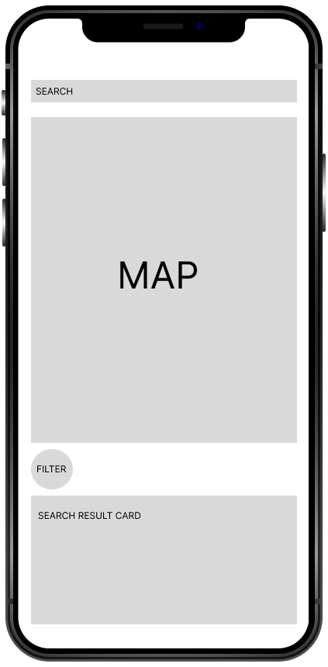
4 components needed:


map search bar
map
filter
search result card
Improved information architecture: filter logic applied to data categories
With the support of YDD's Special Projects Data Analysis team and City Pathways fellows, data was cleaned and standardized following recommended character counts.
Collapsed categories were created for age groups and cost.
A collaborative effort
Next Step:
Test the new features, receive feedback and make any improvements.
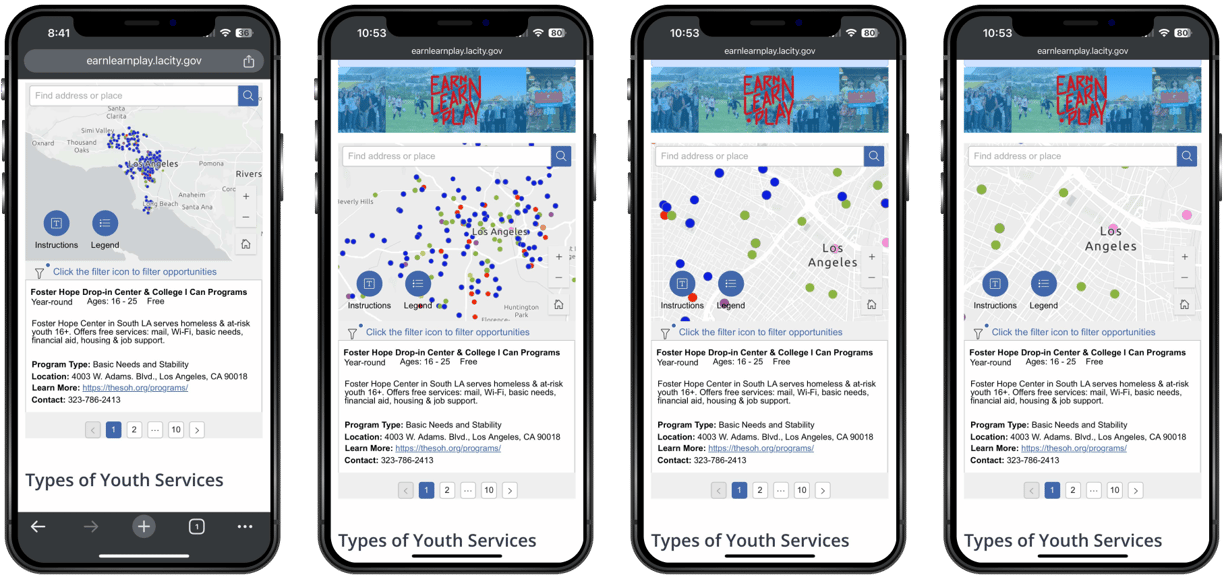
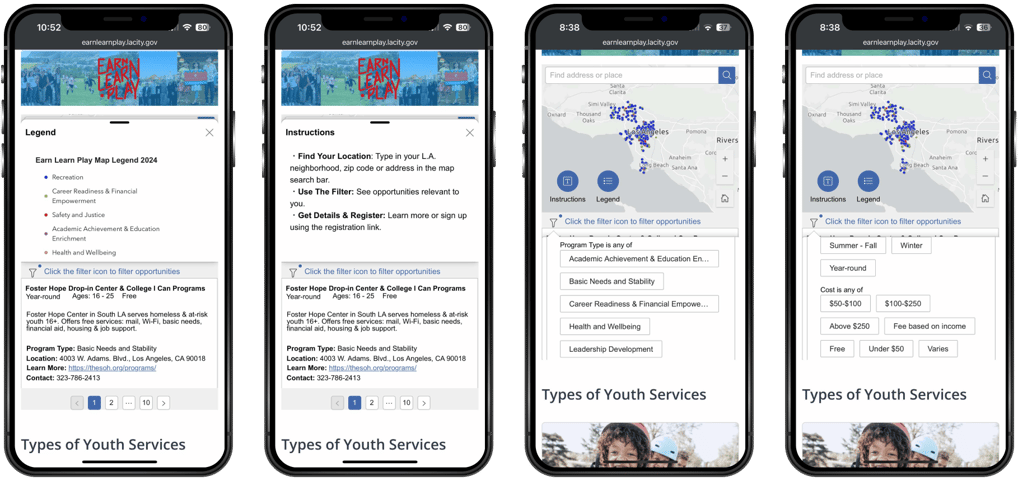
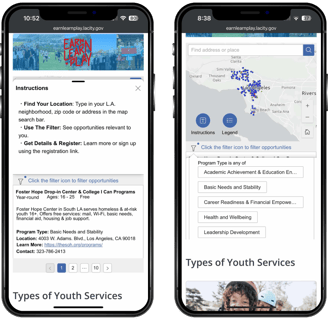
ELP 2.0: Mobile Improvements
improvement needed: mobile experience needed to be more comprehensive because there were no instructions or a map legend shown like desktop
Mobile feedback was key since mobile makes up 70% of traffic.
"everything is much clearer on desktop and your eyes can easily see everything to understand how the map works"
- YDD youth fellow
"I'm not sure what the colored dots represent on the map on mobile view. Does the green symbolize 'food'?"
- YDD youth fellow
VS
Floating Action Buttons Added to Mobile Experience
"I didn't expect and enjoyed that you can click on any dot and its result would appear."
"a lot of college students might find this resource helpful since it's easy to use."
"
"I would 100% recommend to other people since [the tool] is really organized, straightforward and clear. Usually it's hard to find programs in your area and this lets you know what is in your area or if you have to go somewhere."
"
"I'm thinking of people I could share this with."
"
"This is amazing."
"
- LA youth fellows
Future Improvements
smart search enabling users to explore opportunities through keywords
translations to serve the diverse languages of Los Angeles
map symbology icons that represent each opportunity category for fast recognition
Team & Roles
Director of Strategic Planning, Data, Research, and Special Projects
Data Analyst, PhD
Data Management Aids, youth members
City Pathways Fellows
UX/UI Product Design Lead
Principal Public Relations
Youth Council
Data & Computer Science Research Fellows
YDD vision alignment, timelines, validation of strategy & features
project management and data management
data management support, listening session participant
data management support, listening session participants, youth case management, Earn Learn Play support form outreach
product design strategist & lead, ux/ui, interaction design, introduction of SCRUM development
listening and focus group session coordinator
listening session participants, survey participants, target audience product feedback
automated data pipeline, custom search code recommendations
Development Methodology
Given the scale and scope of the project, an agile SCRUM framework was used to adapt to changing requirements and prioritized functionalities.
Earn Learn Play is a newly established citywide initiative. The interactive map was rebuilt from the ground up starting from user research to concept to build to iteration changes during development.
Using the MoSCoW prioritization technique, large requirements were broken down into smaller tasks while evaluating priority requirements in an agile team, delivering time-boxed iterations in sprints.

developed in ArcGIS Experience Builder
Learnings
During testing we concluded that search would have been too open-ended for users who are new to using this resource and they would likely not know what to search for. If searches were inputted (ie "sustainability" ) but a non-exact match delivered 0 results, then users would naturally defer from the website if this happened multiple times.
To negate this experience, we decided to focus efforts on showing opportunities at a glance by having the ability to filter them based on criteria and interested programs. We would need a more sophisticated and refined understanding of all data and develop custom search logic code surrounding bigger keywords such as "art" "sports" "community" "work" "internships" etc. Search trends from users could also be analyzed to define big keyword group parameters.
The challenging part of this project was translating the varying levels of data across many different departments into a harmonious geographic information experience, which affected components to be used, software data connections and overall user flows and interactions with the map.
Data standardization helped unify all the content that lived in this interactive experience. We did lots of testing to troubleshoot how different searches would affect search return. In our most early work in progress prototype that did not get released publicly, there was a horizontal navigation bar that had a search function and 'near me' function.
contract with Emily Niemann, owner of cosmo design employed by Odesus Inc.